cvd - UK data summary : 6th June 2021
cvd - UK daily cases (+ra), 6th June 2021
cvd - UK vax trajectory, 6th June 2021
cvd - UK daily vax both doses, 6th June 2021
cvd - UK daily deaths (+ra), 6th June 2021
cvd - UK data summary : 7th June 2021
cvd - UK daily cases (+ra), 7th June 2021
cvd - UK daily vax, both doses, 7th June 2021
cvd - UK, virus timeseries [ONS], 4th June 2021
cvd - hospital cases; NW England & Scotland, 8th J…
cvd - 2nd dose take-up [7th June 2o21]
cvd - vaccine uptake in England [9th June 2021]
cvd - futher modelling for variants
bwc - breakfast
bwc - don't mind me
bwc - how close ?
bwc - who's there ?
bwc - cat gone
bwc - Ben's finished ...
bwc - second helpings
bwc - mealtime
HWH - Cawfields Quarry
BDD - hurry up !
cvd - transmission modelling (June 2021)
cvd / O&S(meme) - gateway ?
gld - SSW Meradalir [webcam still 20210601 1240]
gld - SSW Meradalir [webcam still 20210601 0220]
gld - vents as at 17th May 2021
gld - vent names, mid April 2021
cvd - Bolton, patients on ventilation [2021-06-05]
cvd - UK patients in Bolton hospital [2021-06-05]
cvd - PHE data, cluster by educational setting
cvd - death statistics in England
cvd - UK vaxx percentages, 5th June 2021
cvd - global vaccinations
cvd - UK hospital cases, 5th June 2021
cvd - UK daily deaths (+ra), 5th June 2021
cvd - UK daily vax, both doses, 5th June 2021
cvd - UK vax trajectory, 5th June 2021
cvd - UK, daily cases (+ra), 5th June 2021
cvd - UK data summary : 5th June 2021
cvd - UK daily vax both doses, 4th June 2021
cvd - UK daily cases (+ra), 4th June 2021
cvd - UK data summary : 4th June 2021
cvd - UK regional "R" ; 4th June 2021
Keywords
Authorizations, license
-
Visible by: Everyone -
All rights reserved
-
52 visits
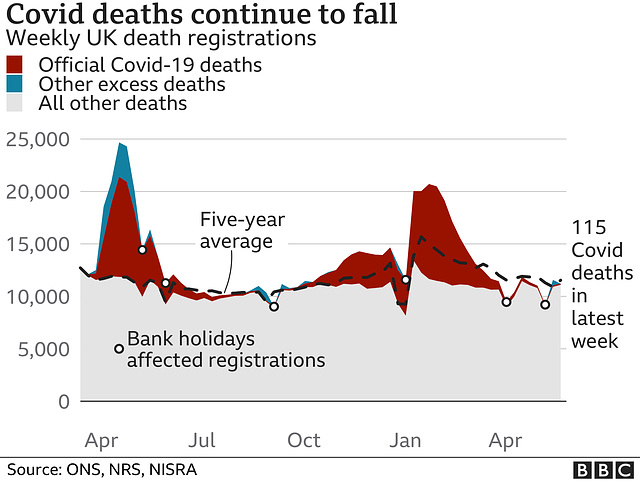
cvd - UK mortality vs average ; 2nd June 2021


Period up to late May (prior to the Bank Holiday) showing the actual deaths against the 5-year average.
Not my Image ; Fair Use & public information
Not my Image ; Fair Use & public information
- Keyboard shortcuts:
Jump to top
RSS feed- Latest comments - Subscribe to the comment feeds of this photo
- ipernity © 2007-2024
- Help & Contact
|
Club news
|
About ipernity
|
History |
ipernity Club & Prices |
Guide of good conduct
Donate | Group guidelines | Privacy policy | Terms of use | Statutes | In memoria -
Facebook
Twitter

Not my Image ; Fair Use & public information
Sign-in to write a comment.